A 2.76% gain for speculative grade Asian notes denominated in U.S. dollars this year is nearly 2% behind the gain for high grade bonds, according to data from JPMorgan Chase. The reversal of fortunes comes as China's economy continues to slow and officials raise expectations of more defaults. (Bloomberg)
Tuesday, 13 May 2014
Risk Sensor: Study finds high rate of unoccupied housing units in China
Adding another data point to gauge the state of China's property market, a study by CLSA finds a high 15% vacancy rate in the nation's housing, leaving 10.2 million units unoccupied. The report says that total could rise by up to 4 million units annually. (China Daily).

Tuesday, 21 February 2012
Shanghai relaxes home purchase restrictions
* Non-local residents are now qualified to buy 2nd homes once they've
held residence permits for 3yrs. (Shanghai Securities News)
* Residence permit holders previously were not allowed to buy 2nd homes
in Shanghai
* Local agents believe this is a relaxation policy as there has never
been such a case that non-local residents could buy 2 homes.
More customized relaxation on the property market later?
held residence permits for 3yrs. (Shanghai Securities News)
* Residence permit holders previously were not allowed to buy 2nd homes
in Shanghai
* Local agents believe this is a relaxation policy as there has never
been such a case that non-local residents could buy 2 homes.
More customized relaxation on the property market later?
Wednesday, 20 July 2011
Tuesday, 5 April 2011
Incoming! Interest Rate Risk...
"Pimco to Raise $600 Million for REIT to Buy Mortgage Debt..."
Although most central bankers in the developed world still maintain a low interest rate environment to support the economy recovery, they might soon reverse the process more abruptly than the market predict. When they do that, short term interest rate tend to spike up quickly. Pimco certainly anticipate such a scenario, and preparing for it by reducing the duration of their fixed income investments, in other words, they start to move from the short end of the yield curve (short terms bond investments) to the long end of the yield curve (long terms bond investment such as mortgage debt). It is a key signal for other bond investors to follow in the market place.
Maybe our sovereign wealth fund should do the same thing to hedge against the perceived interest rate risks?
Although most central bankers in the developed world still maintain a low interest rate environment to support the economy recovery, they might soon reverse the process more abruptly than the market predict. When they do that, short term interest rate tend to spike up quickly. Pimco certainly anticipate such a scenario, and preparing for it by reducing the duration of their fixed income investments, in other words, they start to move from the short end of the yield curve (short terms bond investments) to the long end of the yield curve (long terms bond investment such as mortgage debt). It is a key signal for other bond investors to follow in the market place.
Maybe our sovereign wealth fund should do the same thing to hedge against the perceived interest rate risks?
Sunday, 27 March 2011
Gold at $3000?
This chart tracks the the performance of gold since July of 2002 against the three largest bubbles of the last 40 years. Past bubbles have shown strong but steady growth for the first 7-8 years before moving into a hyper-growth phase for the last 18-24 months. Each series is adjusted for inflation and is smoothed with a 3-month moving average.


Tuesday, 7 September 2010
Saving the economy, or saving the bubble?
An interesting article published on the Caijing.com.
http://www.caijing.com.cn/2010-09-07/110515467.html
http://www.caijing.com.cn/2010-09-07/110515467.html
Wednesday, 13 January 2010
Bear Index
An interesting chart regarding the investment preferences for gold these days. I think I am a cub...


Monday, 11 January 2010
Avatar
Avatar has certainly become one of the hot topics these days. The two-and-a half hour Twentieth Century-Fox movie that cost about $300 million to produce and an additional $100 million to market breaks the creative barriers that have stymied 3D technology for decades. “(It) will set off a new wave of 3D film making in the years to come and is likely to accelerate consumer interest in in-home 3D,” said Pali Capital analyst Richard Greenfield. Piper Jaffray estimates the 3D market will grow from $5.5 billion this year to $25 billion by 2012 at a compound annual rate of 50 percent.
To get the 3D visual experience, the viewer in the cinema has to wear a silly looking 3D glasses that mimic stereoscopic vision. However, this may not be necessary. Indeed, a PhD student at Carnegie Mellon University had taken a standard Nintendo Wii remote and turned a monitor into 3D VR display.
To get the 3D visual experience, the viewer in the cinema has to wear a silly looking 3D glasses that mimic stereoscopic vision. However, this may not be necessary. Indeed, a PhD student at Carnegie Mellon University had taken a standard Nintendo Wii remote and turned a monitor into 3D VR display.
Dynamic Multiple Portfolio Gain Insurance Strategy
I have recently developed a principal protection strategy called "Dynamic Multiple Portfolio Gain Insurance".
Compared to the traditional CPPI (Constant Proportion Portfolio Insurance) strategy, it has two features: dynamic multiple and gain protection.
Unlike the CPPI which normally sets the multiple fix at the beginning of the portfolio investing, the DMPGI set the multiple within a range of possible vlaues, conditional on the downside risk of the risky asset. Therefore, it recognizes the essential fact that the risk of the risky underlying asset changes according to market evolutions.
It is also different from the CPPI as the protection level is not based on the beginning value of the portfolio investments but the highest level of the portfolio (gains) throughout the life of the investments, which is appealing to investors who do want to participate in the upside potentials to some extents and do want to lock in those gains.
The following example is based on the S&P/TSX 60 Index and is carried out in the Matlab application.

Compared to the traditional CPPI (Constant Proportion Portfolio Insurance) strategy, it has two features: dynamic multiple and gain protection.
Unlike the CPPI which normally sets the multiple fix at the beginning of the portfolio investing, the DMPGI set the multiple within a range of possible vlaues, conditional on the downside risk of the risky asset. Therefore, it recognizes the essential fact that the risk of the risky underlying asset changes according to market evolutions.
It is also different from the CPPI as the protection level is not based on the beginning value of the portfolio investments but the highest level of the portfolio (gains) throughout the life of the investments, which is appealing to investors who do want to participate in the upside potentials to some extents and do want to lock in those gains.
The following example is based on the S&P/TSX 60 Index and is carried out in the Matlab application.

Monday, 2 November 2009
The fund selection sting: What criteria?
Many studies deal with the sustainability of performance, but few with their determinants. Which qualitative or quantitative factors, we should leave as long-suffering in the Institutional fund selection?
To address the above question, I establish robust results by comparing the performance of different fund portfolios formed based upon objective fund qualitative and quantitative fund performance factors, providing an economically meaningful measure of the magnitude of the relation between performance and attributes. The article has been recently quoted by the magazine of Institutional Money in Germany.
http://www.institutional-money.com/cms/magazin/uebersicht/artikel/die-fondsauswahl-welche-kriterien-stechen/?tx_ttnews[backPid]=15&cHash=9dea4ae647
To address the above question, I establish robust results by comparing the performance of different fund portfolios formed based upon objective fund qualitative and quantitative fund performance factors, providing an economically meaningful measure of the magnitude of the relation between performance and attributes. The article has been recently quoted by the magazine of Institutional Money in Germany.
http://www.institutional-money.com/cms/magazin/uebersicht/artikel/die-fondsauswahl-welche-kriterien-stechen/?tx_ttnews[backPid]=15&cHash=9dea4ae647
Thursday, 15 October 2009
Is diversification dead? A new look at asset allocation
I recently wrote an artitle on multi-asset investing for Professional Wealth Management magazine which is part of the Financial Times Group.
Basically, the perfect storm of the financial crisis nullified the supposed diversification benefits of multi-asset class strategies, but it is argued that for a range of innovative featues, they can provide investors with a more efficient and effective diversification strategy.
For more details, please refer to the following web link.
http://www.pwmnet.com/news/get_file.php3/id/297/file/p23+pwm.pdf
Basically, the perfect storm of the financial crisis nullified the supposed diversification benefits of multi-asset class strategies, but it is argued that for a range of innovative featues, they can provide investors with a more efficient and effective diversification strategy.
For more details, please refer to the following web link.
http://www.pwmnet.com/news/get_file.php3/id/297/file/p23+pwm.pdf
Wednesday, 14 October 2009
"Honey, I Shrunk the Portfolio Concentration Risk!"
The 2008 crisis was unique in terms of its speed, the jump in correlations and the fall in liquidity. Multiple asset-class returns have been headed in the same direction: down!
The dramatic downturn in 2008 severely shook the confidence of investors in the ability of traditional risk management practices to mitigate their downside exposure. Traditional portfolio optimization with asset weights constraints might not generate truly risk-diversified portfolio. The resulting optimal portfolios tend to be overly concentrated in a very limited subset of the full assets or securities spectrum. For example, traditional 60/40 (i.e., S&P 500 and Lehman Aggregate) or so-called balanced portfolios do not offer investors true diversification because the 60% stock allocation (S&P 500) actually accounts for almost 95% of the portfolio risk. In a sense, 60/40 portfolios put almost all the “eggs” in one basket. When (not if) the stock market has a severe downturn (as witnessed recently), 60/40 portfolios would also suffer tremendous losses.
A direct relationship exists between loss contribution to a portfolio from its underlying components, and their risk contribution counterparts. The risk contribution of component i is the share of total risk of the portfolio which is attributable to this component.
I propose a simple way to measure the homogeneity of risk contributions, which is related to the efficiency of the portfolio risk diversification. The risk diversification efficiency measure guarantees that the risk contribution weights are not too widespread. It works with negative risk contributions which are typical with bonds in a traditional portfolio, due to the negative correlations with stocks or alternative assets. The lower the value of the risk diversification measure, the more efficient the risk diversification of the portfolio.
The dramatic downturn in 2008 severely shook the confidence of investors in the ability of traditional risk management practices to mitigate their downside exposure. Traditional portfolio optimization with asset weights constraints might not generate truly risk-diversified portfolio. The resulting optimal portfolios tend to be overly concentrated in a very limited subset of the full assets or securities spectrum. For example, traditional 60/40 (i.e., S&P 500 and Lehman Aggregate) or so-called balanced portfolios do not offer investors true diversification because the 60% stock allocation (S&P 500) actually accounts for almost 95% of the portfolio risk. In a sense, 60/40 portfolios put almost all the “eggs” in one basket. When (not if) the stock market has a severe downturn (as witnessed recently), 60/40 portfolios would also suffer tremendous losses.
A direct relationship exists between loss contribution to a portfolio from its underlying components, and their risk contribution counterparts. The risk contribution of component i is the share of total risk of the portfolio which is attributable to this component.
I propose a simple way to measure the homogeneity of risk contributions, which is related to the efficiency of the portfolio risk diversification. The risk diversification efficiency measure guarantees that the risk contribution weights are not too widespread. It works with negative risk contributions which are typical with bonds in a traditional portfolio, due to the negative correlations with stocks or alternative assets. The lower the value of the risk diversification measure, the more efficient the risk diversification of the portfolio.
An Innovative ETFs Solution based on Core- Satellite Framework
Core/Satellite delivers the best of both worlds. Passive core investments gives the investor a low cost , tax effective and diversified portfolio, while active satellite exposures gives potential for enhanced returns. The core component of the portfolio is attuned to the investor’s long-term strategic aims, comprising assets that reflect the investor’s appetite for risk. The risk and return are optimally balanced in line with the investment goals of the


Friday, 2 October 2009
Taming the Beast for the Beauty - The "FIT" Framework for Currency Strategy
As you may notice, the FX market has become extremely volatile recently, thanks for the obscure economic outlook and the massive money printing process of major central banker all around the world.
Yes, high volatility means more investment opportunities,only if one can find the "holy grail" for the market. Unlike those traditional trading models built on price momentum (technical models) or rate differentials (the carry trade model), I have recently developed a new framework for currency trading which employs a nubmer of factors including Fundamental factor, Irrational factor, and Technical factor. The FIT model (the abbreviation for the first letter of all the three factor categories) is built as a fusion of fundamental analysis and financial engineering, which may benefit from pronounced up or down trends in the global FX markets. The currencies included in the strategy are Euros, British Pounds, Canadian Dollars, Swiss Francs, Australian Dollars, and Japanese Yen.
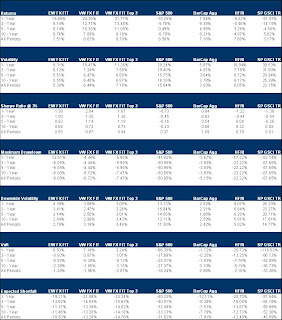
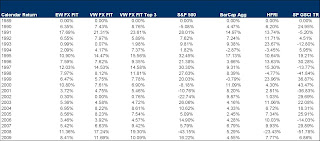
The following tables show the historical backtesting results for the strategy. Over the last 20 year, only 2 years realized small negative returns (-0.36% for 1994 and -0.19% for 2007)…
Yes, high volatility means more investment opportunities,only if one can find the "holy grail" for the market. Unlike those traditional trading models built on price momentum (technical models) or rate differentials (the carry trade model), I have recently developed a new framework for currency trading which employs a nubmer of factors including Fundamental factor, Irrational factor, and Technical factor. The FIT model (the abbreviation for the first letter of all the three factor categories) is built as a fusion of fundamental analysis and financial engineering, which may benefit from pronounced up or down trends in the global FX markets. The currencies included in the strategy are Euros, British Pounds, Canadian Dollars, Swiss Francs, Australian Dollars, and Japanese Yen.
The following tables show the historical backtesting results for the strategy. Over the last 20 year, only 2 years realized small negative returns (-0.36% for 1994 and -0.19% for 2007)…


Tuesday, 25 August 2009
Gold, Gold, Gold, Ale Ale Ale!!!
In May this year, I posted a note on a dynamic commodity long/short strategy which tries to establish a bull/bear signal for a specific component commodity market. Currently the model is signalling a bullish outlook for the precious metals sector, including gold and silver, for the coming month. Indeed, the signal is really strong as the underlying composite factors including fundamental factor, momentum factor, and market sentiment factor all point to the potential upside.
Interestingly, an article on Bloomberg today also confirmed the bullish outlook for gold.
"Gold will rise to more than $1,000 an ounce next month based on moving-average “deja vu” patterns since the start of 2005, according to Barclays Capital.
JPMorgan Chase & Co., Standard Chartered Bank and three other financial companies predicted bullion would top $1,000 in the fourth quarter, the survey by Bloomberg showed."
The party for gold has yet started....
Interestingly, an article on Bloomberg today also confirmed the bullish outlook for gold.
"Gold will rise to more than $1,000 an ounce next month based on moving-average “deja vu” patterns since the start of 2005, according to Barclays Capital.
JPMorgan Chase & Co., Standard Chartered Bank and three other financial companies predicted bullion would top $1,000 in the fourth quarter, the survey by Bloomberg showed."
The party for gold has yet started....
Monday, 24 August 2009
An Innovative Asset Allocation Framework for Alternative Investment Strategies
Firstly, portfolio optimization tools based on normally distributed as
Secondly, given the non-normality of the return distribution
Thirdly, traditional portfolio optimization with asset weights constraints might not generate truly risk-diversified portfolio. The resulting optimal portfolios tend to be overly concentrated in a very limited subset of the full assets or securities spectru


Friday, 3 July 2009
Multi-Asset Class Investing
I recently wrote an article for the magazine of Portfolio Adviser on the topic of multi-asset class strutured products.
The current market environment has left investors struggling to generate high yields and capital growth from traditional asset classes. The current low interest rate environment means bonds may minimise risks but do not satisfy an investor’s appetite for yield. As correlations are currently high between equity indices, satisfactory portfolio diversification is harder to obtain using pure equity strategies. This is leading investors to seek yield from new asset classes or a composite of asset classes.
For more details, please refer to the following link:
http://junhua.lu.googlepages.com/MyCerosDownload.pdf
The current market environment has left investors struggling to generate high yields and capital growth from traditional asset classes. The current low interest rate environment means bonds may minimise risks but do not satisfy an investor’s appetite for yield. As correlations are currently high between equity indices, satisfactory portfolio diversification is harder to obtain using pure equity strategies. This is leading investors to seek yield from new asset classes or a composite of asset classes.
For more details, please refer to the following link:
http://junhua.lu.googlepages.com/MyCerosDownload.pdf
Thursday, 2 July 2009
Dancing with Wolves? No, Dancing with Oil!
The correlations between oil and other asset classes have picked up a lot (either positive or negative) recently, which may provide excellent trading opportunities...
The correlation between oil and equity is high currently:

The correlation between oil and bond is significantly negative...

The correlation with FX (US dollar):

The correlation between oil and real estate:

The correlation between oil and hedge fund performance:

The correlation between oil and equity is high currently:

The correlation between oil and bond is significantly negative...

The correlation with FX (US dollar):

The correlation between oil and real estate:

The correlation between oil and hedge fund performance:

Tuesday, 30 June 2009
Investing in Dividends
Dividends are an important part of the total return stream of S&P 500, contributing one-third of long term total returns. S&P 500 linked index derivatives have meaningful exposure to dividend risk.
The chart illustrates peaks and troughs in dividend points, highlighting the importance of dividend risk management tools.

The figure illustrates the breakdown of S&P 500 dividend points across sectors over the past decade. At the beginning of the decade, dividend point contribution is more evenly split across the sectors relative to the end of 2008. The top three dividend weights at the beginning of the decade were financials, consumer staples, and energy, which accounted for 44.4% of the total dividend points of the S&P 500. At the end of the period, the top three dividend point contributors were financials, consumer staples, and industrials, which in total accounted for 48.5% of the total dividend points of the S&P 500.

The chart plots the relationship between the S&P 500 dividend growth and the headline CPI rate during the last 20 years. It suggests that dividend growth remained elevated during periods when inflation spiked above trend levels. To take the example of 1990-91, this is the last time the US experienced a phase of above-trend inflation and below-trend growth, or “stagflation-light”. Dividends per share rose by as much as 15% that year and closely followed the trend in inflation. In more recent years, with the commodity boom, dividend growth has persistently remained above 10%, providing decent inflation protection at a time when year on year headline CPI growth has moved above 4%. Recently, as the economic recession deepened and CPI number dropped dramatically, dividend growth has plummeted and entered the negative territory. The positive correlation with inflation may be attractive to investors – particularly those attempting to hedge longer-dated inflation-linked liabilities – where there are because low real yields on index-linked securities.

Hence, dividends may prove to a strong alternative asset to provide inflation protection. The advent of the exchange-traded futures on index dividend market seem likely to eventually rehabilitate equities as an inflation hedge, largely because dividends provide a portion of equity total returns free of the inveterate volatility caused by swings in equity valuation.
Besides using the index dividend as a sole inflation-hedging investment vehicle, the index dividend can also be used to improve the risk-return profile of a portfolio hedging against inflation. Using a future on index dividend, one can achieve a reasonable dividend exposure, providing inflation protection and diversification. As an example we build a portfolio including Commodities (S&P GSCI Index), Inflation-Linked Bonds (Barclay Capital US TIPS Index), and the S&P 500 Dividend Growth data. As shown in the figure, this portfolio exhibits less volatility and higher Sharpe ratio with respect to a portfolio that doesn’t include the S&P 500 Dividend Growth.

For those readers who are interested in the idea of investing in dividends, please refer to a paper I wrote recently on the topic of dividend investing on ssrn.com
http://papers.ssrn.com/sol3/papers.cfm?abstract_id=1425518
The chart illustrates peaks and troughs in dividend points, highlighting the importance of dividend risk management tools.

The figure illustrates the breakdown of S&P 500 dividend points across sectors over the past decade. At the beginning of the decade, dividend point contribution is more evenly split across the sectors relative to the end of 2008. The top three dividend weights at the beginning of the decade were financials, consumer staples, and energy, which accounted for 44.4% of the total dividend points of the S&P 500. At the end of the period, the top three dividend point contributors were financials, consumer staples, and industrials, which in total accounted for 48.5% of the total dividend points of the S&P 500.

The chart plots the relationship between the S&P 500 dividend growth and the headline CPI rate during the last 20 years. It suggests that dividend growth remained elevated during periods when inflation spiked above trend levels. To take the example of 1990-91, this is the last time the US experienced a phase of above-trend inflation and below-trend growth, or “stagflation-light”. Dividends per share rose by as much as 15% that year and closely followed the trend in inflation. In more recent years, with the commodity boom, dividend growth has persistently remained above 10%, providing decent inflation protection at a time when year on year headline CPI growth has moved above 4%. Recently, as the economic recession deepened and CPI number dropped dramatically, dividend growth has plummeted and entered the negative territory. The positive correlation with inflation may be attractive to investors – particularly those attempting to hedge longer-dated inflation-linked liabilities – where there are because low real yields on index-linked securities.

Hence, dividends may prove to a strong alternative asset to provide inflation protection. The advent of the exchange-traded futures on index dividend market seem likely to eventually rehabilitate equities as an inflation hedge, largely because dividends provide a portion of equity total returns free of the inveterate volatility caused by swings in equity valuation.
Besides using the index dividend as a sole inflation-hedging investment vehicle, the index dividend can also be used to improve the risk-return profile of a portfolio hedging against inflation. Using a future on index dividend, one can achieve a reasonable dividend exposure, providing inflation protection and diversification. As an example we build a portfolio including Commodities (S&P GSCI Index), Inflation-Linked Bonds (Barclay Capital US TIPS Index), and the S&P 500 Dividend Growth data. As shown in the figure, this portfolio exhibits less volatility and higher Sharpe ratio with respect to a portfolio that doesn’t include the S&P 500 Dividend Growth.

For those readers who are interested in the idea of investing in dividends, please refer to a paper I wrote recently on the topic of dividend investing on ssrn.com
http://papers.ssrn.com/sol3/papers.cfm?abstract_id=1425518
Subscribe to:
Posts (Atom)


 Posts
Posts


