Many studies deal with the sustainability of performance, but few with their determinants. Which qualitative or quantitative factors, we should leave as long-suffering in the Institutional fund selection?
To address the above question, I establish robust results by comparing the performance of different fund portfolios formed based upon objective fund qualitative and quantitative fund performance factors, providing an economically meaningful measure of the magnitude of the relation between performance and attributes. The article has been recently quoted by the magazine of Institutional Money in Germany.
http://www.institutional-money.com/cms/magazin/uebersicht/artikel/die-fondsauswahl-welche-kriterien-stechen/?tx_ttnews[backPid]=15&cHash=9dea4ae647
Monday, 2 November 2009
Thursday, 15 October 2009
Is diversification dead? A new look at asset allocation
I recently wrote an artitle on multi-asset investing for Professional Wealth Management magazine which is part of the Financial Times Group.
Basically, the perfect storm of the financial crisis nullified the supposed diversification benefits of multi-asset class strategies, but it is argued that for a range of innovative featues, they can provide investors with a more efficient and effective diversification strategy.
For more details, please refer to the following web link.
http://www.pwmnet.com/news/get_file.php3/id/297/file/p23+pwm.pdf
Wednesday, 14 October 2009
"Honey, I Shrunk the Portfolio Concentration Risk!"
The 2008 crisis was unique in terms of its speed, the jump in correlations and the fall in liquidity. Multiple asset-class returns have been headed in the same direction: down!
The dramatic downturn in 2008 severely shook the confidence of investors in the ability of traditional risk management practices to mitigate their downside exposure. Traditional portfolio optimization with asset weights constraints might not generate truly risk-diversified portfolio. The resulting optimal portfolios tend to be overly concentrated in a very limited subset of the full assets or securities spectrum. For example, traditional 60/40 (i.e., S&P 500 and Lehman Aggregate) or so-called balanced portfolios do not offer investors true diversification because the 60% stock allocation (S&P 500) actually accounts for almost 95% of the portfolio risk. In a sense, 60/40 portfolios put almost all the “eggs” in one basket. When (not if) the stock market has a severe downturn (as witnessed recently), 60/40 portfolios would also suffer tremendous losses.
A direct relationship exists between loss contribution to a portfolio from its underlying components, and their risk contribution counterparts. The risk contribution of component i is the share of total risk of the portfolio which is attributable to this component.
I propose a simple way to measure the homogeneity of risk contributions, which is related to the efficiency of the portfolio risk diversification. The risk diversification efficiency measure guarantees that the risk contribution weights are not too widespread. It works with negative risk contributions which are typical with bonds in a traditional portfolio, due to the negative correlations with stocks or alternative assets. The lower the value of the risk diversification measure, the more efficient the risk diversification of the portfolio.
An Innovative ETFs Solution based on Core- Satellite Framework
Core/Satellite delivers the best of both worlds. Passive core investments gives the investor a low cost , tax effective and diversified portfolio, while active satellite exposures gives potential for enhanced returns. The core component of the portfolio is attuned to the investor’s long-term strategic aims, comprising assets that reflect the investor’s appetite for risk. The risk and return are optimally balanced in line with the investment goals of the


Friday, 2 October 2009
Taming the Beast for the Beauty - The "FIT" Framework for Currency Strategy
As you may notice, the FX market has become extremely volatile recently, thanks for the obscure economic outlook and the massive money printing process of major central banker all around the world.
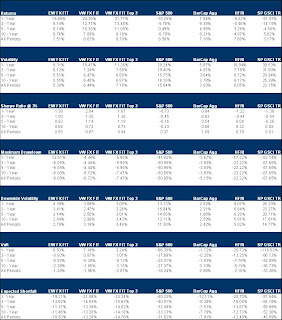
Yes, high volatility means more investment opportunities,only if one can find the "holy grail" for the market. Unlike those traditional trading models built on price momentum (technical models) or rate differentials (the carry trade model), I have recently developed a new framework for currency trading which employs a nubmer of factors including Fundamental factor, Irrational factor, and Technical factor. The FIT model (the abbreviation for the first letter of all the three factor categories) is built as a fusion of fundamental analysis and financial engineering, which may benefit from pronounced up or down trends in the global FX markets. The currencies included in the strategy are Euros, British Pounds, Canadian Dollars, Swiss Francs, Australian Dollars, and Japanese Yen.
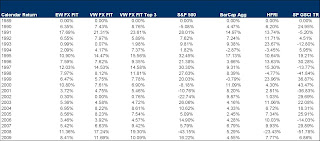
The following tables show the historical backtesting results for the strategy. Over the last 20 year, only 2 years realized small negative returns (-0.36% for 1994 and -0.19% for 2007)…
Yes, high volatility means more investment opportunities,only if one can find the "holy grail" for the market. Unlike those traditional trading models built on price momentum (technical models) or rate differentials (the carry trade model), I have recently developed a new framework for currency trading which employs a nubmer of factors including Fundamental factor, Irrational factor, and Technical factor. The FIT model (the abbreviation for the first letter of all the three factor categories) is built as a fusion of fundamental analysis and financial engineering, which may benefit from pronounced up or down trends in the global FX markets. The currencies included in the strategy are Euros, British Pounds, Canadian Dollars, Swiss Francs, Australian Dollars, and Japanese Yen.
The following tables show the historical backtesting results for the strategy. Over the last 20 year, only 2 years realized small negative returns (-0.36% for 1994 and -0.19% for 2007)…


Tuesday, 25 August 2009
Gold, Gold, Gold, Ale Ale Ale!!!
In May this year, I posted a note on a dynamic commodity long/short strategy which tries to establish a bull/bear signal for a specific component commodity market. Currently the model is signalling a bullish outlook for the precious metals sector, including gold and silver, for the coming month. Indeed, the signal is really strong as the underlying composite factors including fundamental factor, momentum factor, and market sentiment factor all point to the potential upside.
Interestingly, an article on Bloomberg today also confirmed the bullish outlook for gold.
"Gold will rise to more than $1,000 an ounce next month based on moving-average “deja vu” patterns since the start of 2005, according to Barclays Capital.
JPMorgan Chase & Co., Standard Chartered Bank and three other financial companies predicted bullion would top $1,000 in the fourth quarter, the survey by Bloomberg showed."
The party for gold has yet started....
Monday, 24 August 2009
An Innovative Asset Allocation Framework for Alternative Investment Strategies
Firstly, portfolio optimization tools based on normally distributed as
Secondly, given the non-normality of the return distribution
Thirdly, traditional portfolio optimization with asset weights constraints might not generate truly risk-diversified portfolio. The resulting optimal portfolios tend to be overly concentrated in a very limited subset of the full assets or securities spectru


Friday, 3 July 2009
Multi-Asset Class Investing
I recently wrote an article for the magazine of Portfolio Adviser on the topic of multi-asset class strutured products.
The current market environment has left investors struggling to generate high yields and capital growth from traditional asset classes. The current low interest rate environment means bonds may minimise risks but do not satisfy an investor’s appetite for yield. As correlations are currently high between equity indices, satisfactory portfolio diversification is harder to obtain using pure equity strategies. This is leading investors to seek yield from new asset classes or a composite of asset classes.
For more details, please refer to the following link:
http://junhua.lu.googlepages.com/MyCerosDownload.pdf
Thursday, 2 July 2009
Dancing with Wolves? No, Dancing with Oil!
The correlations between oil and other asset classes have picked up a lot (either positive or negative) recently, which may provide excellent trading opportunities...
The correlation between oil and equity is high currently:

The correlation between oil and bond is significantly negative...

The correlation with FX (US dollar):

The correlation between oil and real estate:

The correlation between oil and hedge fund performance:

The correlation between oil and equity is high currently:

The correlation between oil and bond is significantly negative...

The correlation with FX (US dollar):

The correlation between oil and real estate:

The correlation between oil and hedge fund performance:

Tuesday, 30 June 2009
Investing in Dividends
Dividends are an important part of the total return stream of S&P 500, contributing one-third of long term total returns. S&P 500 linked index derivatives have meaningful exposure to dividend risk.
The chart illustrates peaks and troughs in dividend points, highlighting the importance of dividend risk management tools.

The figure illustrates the breakdown of S&P 500 dividend points across sectors over the past decade. At the beginning of the decade, dividend point contribution is more evenly split across the sectors relative to the end of 2008. The top three dividend weights at the beginning of the decade were financials, consumer staples, and energy, which accounted for 44.4% of the total dividend points of the S&P 500. At the end of the period, the top three dividend point contributors were financials, consumer staples, and industrials, which in total accounted for 48.5% of the total dividend points of the S&P 500.

The chart plots the relationship between the S&P 500 dividend growth and the headline CPI rate during the last 20 years. It suggests that dividend growth remained elevated during periods when inflation spiked above trend levels. To take the example of 1990-91, this is the last time the US experienced a phase of above-trend inflation and below-trend growth, or “stagflation-light”. Dividends per share rose by as much as 15% that year and closely followed the trend in inflation. In more recent years, with the commodity boom, dividend growth has persistently remained above 10%, providing decent inflation protection at a time when year on year headline CPI growth has moved above 4%. Recently, as the economic recession deepened and CPI number dropped dramatically, dividend growth has plummeted and entered the negative territory. The positive correlation with inflation may be attractive to investors – particularly those attempting to hedge longer-dated inflation-linked liabilities – where there are because low real yields on index-linked securities.

Hence, dividends may prove to a strong alternative asset to provide inflation protection. The advent of the exchange-traded futures on index dividend market seem likely to eventually rehabilitate equities as an inflation hedge, largely because dividends provide a portion of equity total returns free of the inveterate volatility caused by swings in equity valuation.
Besides using the index dividend as a sole inflation-hedging investment vehicle, the index dividend can also be used to improve the risk-return profile of a portfolio hedging against inflation. Using a future on index dividend, one can achieve a reasonable dividend exposure, providing inflation protection and diversification. As an example we build a portfolio including Commodities (S&P GSCI Index), Inflation-Linked Bonds (Barclay Capital US TIPS Index), and the S&P 500 Dividend Growth data. As shown in the figure, this portfolio exhibits less volatility and higher Sharpe ratio with respect to a portfolio that doesn’t include the S&P 500 Dividend Growth.

For those readers who are interested in the idea of investing in dividends, please refer to a paper I wrote recently on the topic of dividend investing on ssrn.com
http://papers.ssrn.com/sol3/papers.cfm?abstract_id=1425518
Monday, 29 June 2009
What to be blamed for the current crisis?
Today, Bernard Madoff was sentenced to 150 years for masterminding the largest Ponzi scheme in history, six times longer than the penalties meted out to the chief executives of WorldCom Inc. and Enron Corp.
When this case is finally driven to a close, there is certainly something that we can learn from it, not only the lessons that we should bear in our minds that how obvious the crime can be conducted without being noticed for years before people finally get burned by the burst of the Ponzi scheme; but also the deeper understanding the link between the case of Madoff and the origin of the current crisis.
What causes the current crisis? There could be a number of answers to the above question, such as the home price bubble, the weak transparency of mortage back securities, corporate malgovernance, excessively loose monetary policy, etc. These answers might be good to explain one aspect of the current crisis, however, to my opinion, they are just the apparent phenomeno reflecting a deeper origin of the current crisis - Mistrust.
Why Madoff can conduct the Ponzi scheme for years before being caught? Because most people are relying on the judgements of others when they make their investment decisions. For years, Madoff had been a star in the investment community, and was trusted by so many people, especially by those so-called smart people (celebrities and investment bankers). The more people trusted Madoff, the easier for him to gain the trust of others. It is like a snowball which is intially small in size but grows into a huge size of trust from other people. Most of the trust involved is not based upon the truth, the firsthand information, instead, it is based upon the idendities adn reputation of those people who already trusted Madoff. Yes, it is a Ponzi scheme, but it is not only a Ponzi schme of money making, but also a Ponzi scheme of mis-trusts by so many people.
In the run-up to the current crisis, a similar process of Ponzi sheme related to information cascades, because a great many retailed investors have put excessive trust in highly leveraged banks and other business plans, because the central bankers have put excessive trust in the well functioning of the market economy, because a large number of professional investors (institutions) have put excessive trust in the optimistic expectations of others.
Another classic example of "Greed and Fear"!
Thursday, 25 June 2009
Day Trading the Currency Market : Technical and Fundamental Strategies To Profit from Market Swings?
As a following article to the previous one "Currency Volatility and the Disparity of Currency Outlook", I dig out the following book from Google, written by Kathy Lien, a seasoned FX analyst and trader, which could be useful for designing specific FX trading strategies that try to capitalize the heighted volatility in the market place.
Here are some interesting contents taken from her book:
Asian Session (Tokyo): 7 P.m.–4 A.m. EST
FX trading in Asia is conducted in major regional financial hubs; during the Asian trading session, Tokyo takes the largest market share, followed by Hong Kong and Singapore.
For the more risk-tolerant traders, USD/JPY, GBP/CHF, and GBP/JPY are good picks because their broad ranges provide short-term traders with lucrative profit potentials, averaging 90 pips. Foreign investment banks and institutional investors, which hold mostly dollar-dominated assets, generate a significant amount of USD/JPY transactions when they enter the Japanese equity and bond markets. Japan’s central bank, with more than $800 billion of U.S. Treasury securities, also plays an influential role in affecting the supply and demand of USD/JPY through its open market operations. Last but not least, large Japanese exporters are known to use the Tokyo trading hours to repatriate their foreign earnings, heightening the fluctuation of the currency pair. GBP/CHF and GBP/JPY remain highly volatile as central bankers and large players start to scale themselves into positions in anticipation of the opening of the European session.
For the more risk-averse traders, AUD/JPY, GBP/USD, and USD/CHF are good choices because they allow medium-term to long-term traders to take fundamental factors into account when making a decision. The moderate volatility of the currency pairs will help to shield traders and their investment strategies from being prone to irregular market movements due to intraday speculative trades.
U.S. Session (New York): 8 A.m.–5 P.m. EST
New York is the second largest FX marketplace, encompassing 19 percent of total FX market volume turnover according to the 2004 Triennial Central Bank Survey of Foreign Exchange and Derivatives Market Activity in April 2004, published by the Bank for International Settlements (BIS). It is also the financial center that guards the back door of the world’s FX market as trading activity usually winds down to a minimum from its afternoon session until the opening of the Tokyo market the next day. The majority of the transactions during the U.S. Session are executed between 8 a.m. And noon, a period with high liquidity because European traders are still in the market.
For the more risk-tolerant traders, GBP/USD, USD/CHF, GBP/JPY, and GBP/CHF are good choices for day traders since the daily ranges average about 120 pips. Trading activities in these currency pairs are particularly active because these transactions directly involve the U.S. Dollar. When the U.S. Equity and bond markets are open during the U.S. Session, foreign investors have to convert their domestic currency, such as the Japanese yen, the euro, and the Swiss franc, into dollardominated assets in order to carry out their transactions. With the market overlap, GBP/JPY and GBP/CHF have the widest daily ranges.
For the more risk-averse traders, USD/JPY, EUR/USD, and USD/CAD appear to be good choices since these pairs offer traders a decent amount of trading range to garner handsome profits with a smaller amount of risk. Their highly liquid nature allows an investor to secure profits or cut losses promptly and efficiently. The modest volatility of these pairs also provides a favorable environment for traders who want to pursue long-term strategies.
European Session (London): 2 A.m.–12 P.m. EST
London is the largest and most important dealing center in the world, with a market share at more than 30 percent according to the BIS survey.
Most of the dealing desks of large banks are located in London; the majority of major FX transactions are completed during London hours due to the market’s high liquidity and efficiency. The vast number of market participants and their high transaction value make London the most volatile FX market of all. Half of the 12 major pairs surpass the 80 pips line, the benchmark that we used to identify volatile pairs with GBP/JPY and GBP/CHF reaching as high as 140 and 146 pips respectively.
GBP/JPY and GBP/CHF are apt for the risk lovers. These two pairs have an average daily range of more than 140 pips and can be used to generate a huge amount of profits in a short period of time. Such high volatility for the two pairs reflects the peak of daily trade activity as large participants are about to complete their cycle of currency conversion around the world. London hours are directly connected to both the U.S.
And the Asian sessions; as soon as large banks and institutional investors are finished repositioning their portfolios, they will need to start converting the European assets into dollar-denominated ones again in anticipation of the opening of the U.S. Market. The combination of the two reconversions by the big players is the major reason for the extremely high volatility in the pairs.
For the more risk-tolerant traders, there are plenty of pairs to choose from. EUR/USD, USD/CAD, GBP/USD, and USD/CHF, with an average range of 100 pips, are ideal picks as their high volatilities offer an abundance of opportunity to enter the market. As mentioned earlier, trade between the European currencies and the dollars picks up again because the large participants have to reshuffle their portfolios for the opening of the U.S. Session.
For the more risk-averse participants, the NZD/USD, AUD/USD, EUR/CHF, and AUD/JPY, with an average of about 50 pips, are good choices as these pairs provide traders with high interest incomes in additional to potential trade profits. These pairs allow investors to determine their direction of movements based on fundamental economic factors and be less prone to losses due to intraday speculative trades.
U.S.–European Overlap: 8 A.m.–12 P.m. EST
The FX markets tend to be most active when the hours of the world’s two largest trading centers overlap. The range of trading between 8 a.m. And noon EST constitutes on average 70 percent of the total average range of trading for all of the currency pairs during the European trading hours and 80 percent of the total average range of trading for all of the currency pairs during U.S. Trading hours. Just these percentages alone tell day traders that if they are really looking for volatile price action and wide ranges and cannot sit at the screen all day, the time to trade is the U.S. And European overlap.
European–Asian Overlap: 2 A.m.–4 A.m. EST
The trade intensity in the European–Asian overlap is far lower than in any other session because of the slow trading during the Asian morning. Of course, the time period surveyed is relatively smaller as well. With trading extremely thin during these hours, risk-tolerant and risk-loving traders can take a two-hour nap or spend the time positioning themselves for a breakout move at the European or U.S. Open.
Monday, 22 June 2009
Currency Volatility and the Disparity of Currency Outlook
I saw an article on Bloomberg today, discussing the Dollar Forecast Disarray Leading to Higher Volatilityin the currency market (the quoted text are displayed in Italic).
"Redtower Asset Management sees the currency strengthening to $1.16 per euro by year’s end, from $1.3849 today, as the world economy recovers from the first global recession since World War II. Standard Chartered Plc predicts a more stable economy will weaken the dollar to $1.55 as the Federal Reserve keeps its benchmark interest rate near zero to sustain growth, prompting investors to sell greenbacks for higher-returning assets. The 39-cent gap between the high and low calls in Bloomberg’s strategist survey is almost double August 2007’s 20- cent divide. Wider fluctuations increase the risk for so-called carry trades, where money borrowed from countries with low rates is used to invest for higher yields."
Currency volatility has increased dramatically since the credit crunch outbreak in 2008. As shown in the following chart from Bloomberg, over the short term, the 12 week volatility for Euro/USD peaked in December 2008 and then touched the bottom in March 2009, since then, the volatility has picked up significantly by more than 50%. Over the mid term and long term, the 26/52 week volatility followed a rather different pattern as they continued to trend upward into 2009. Nonetheless, the current level is well above its historical norm before 2008 when the crisis began.

Volatility can have a devastating impact on corporate performance, as exporters try to protect overseas earnings. Pittsburgh-based H.J. Heinz Co., the world’s biggest ketchup maker, said on May 28 that its profit fell in the previous three calendar months in the face of “significant FX-related cost headwinds.” Similarly, the heightened volatility in the currency market could put additioanal headwinds for those international airliners, who are already struggling for their diminishing profit base as the economy crisis deepened over time.
Moreover, higher currency volatility could restrict the international investment activities further, in the sense that it makes the cost of international merger and acquisition less predictable and inceases the cost of funding dramatically. The US conglomerate GE announced the £5.7bn deal of acquiring Amersham, the UK medical diagnostics company in October 2003. By the time the deal was completed in May 2004, the dollar had fallen 12 per cent against sterling and GE was forced to pay almost $350m more to close the deal.
Another victims of this heightened currency volatility are probably the emerging market currencies, which have had “a pretty good run” might suffer from increased volatility, as investors flee to safety investments and close their carry-trade posisions quickly.
Friday, 19 June 2009
Deflation or inflation is the question
Today on Bloomberg, there is an article talking about the 36 South Investment Managers Ltd., whose Black Swan Fund gained 234 percent in 2008, is raising money for a new hedge fund, betting that government efforts to pump money into economies could result in hyperinflation.
"Black swan" alludes to the once-widespread belief that all swans are white -- proved false when European explorers found black swans in Australia. A black-swan event is something extreme and highly unexpected.
U.S. President Barack Obama is selling record amounts of debt to try to end the steepest U.S. recession in 50 years, while Japanese Prime Minister Taro Aso has unveiled three stimulus packages worth 25 trillion yen ($261 billion) since taking office in September. Governments around the world selling record amounts of debt may devalue currencies against assets and spark inflation.


Time to think about inflation play?
In the classic investment cycle different types of industry rotate in and out of fashion as the economic cycle progresses, in response to the various stages the profits of each kind of company are most likely to outperform.
Here is a inflation/deflation timing strategy I have developed to help users maximise returns by exploiting this industry rotational phenomenon.

Friday, 12 June 2009
Are we really in the state of de-leveraging?
The Fed published its latest Flow of Funds report today. One key takeaway: While total debt is growing more slowly, it is still growing. Since Q3 ‘08 households have cut their debt (slightly), but the federal government is borrowing so rapidly, overall debt continues to expand. In some ways, what the US governmetn currently doing is not to reduce the debt level and de-leverage the economy, on the contrary, they just transform the massive debts in the private sector to the public sector, and in the end, to the hands of foreign lenders, imagine those countries (China for example) that have accumulated large amounts of US Dollar assets, mainly in the form of US Treasuries.

As a percentage of GDP, debt continues to expand, from 368% at the end of Q4 to 375% at the end of Q1.


As a percentage of GDP, debt continues to expand, from 368% at the end of Q4 to 375% at the end of Q1.

It’s been said that the income statement is the past, but the balance sheet is the future. The balance sheet is getting worse. As the equity value of the economy is going down—think the stock market and housing equity; the debt level is still going up. In other words, as a whole economy, we are still in the process of leveraging, rather than de-leveraging. The origin of the current crisis is the credit bubble, which continues to inflate in the aggregate.
The only way to climb out of a debt-induced depression is to pay down debt or to write it off. Levering up only delays the inevitable.
When will the clock stop for the leveraging bomb?
Thursday, 11 June 2009
Pharmarceuticals are in position to fly...
Today, the World Health Organization to declare the first influenza pandemic since 1968, as a response to the Swine flu, which has caused mostly mild disease outbreaks on four continents.
The swine flu epidemic has hurt certain segments of the market, such as travel stocks, while others, such as shares of pharmaceutical companies, may get a short-term lift, according to observers.
Some of the beneficiaries will be the health care companies that have products that are specific to the swine flu.
Those companies include Roche Holding Ltd. of Basel, Switzerland (RHHBY), which distributes Tamiflu, the primary drug being used to fight swine flu; Gilead Sciences Inc. (GILD) of Foster City, Calif., which holds the patent to Tamiflu; and GlaxoSmithKline PLC of London, which makes Relenza, another drug that can be used to fight the disease.
Friday, 5 June 2009
Anatomy of a Collapse
An impressive chart created by By Barry Ritholtz, which tells us how the current crisis has been developed through time...


Thursday, 4 June 2009

Wednesday, 3 June 2009
iPhone 2009 is coming soon...
There is a rumour that Apple (AAPL) will probably show off its next iPhone on June 8. That's the first day of Apple's 2009 Worldwide Developers Conference, which is when we expect the company to unveil its new iPhone and show off the final version of its iPhone 3.0 software.
Monday, 1 June 2009
Lie to me...
An interesting video released out today on Bloomberg titled with "Wagoner Denies Troubles as GM Slides Toward Bankruptcy". It is interesting, because if you apply some techniques demonstrated by Dr. Cal Lightman, you might get some clues regarding the truthness of the arguments made during the interviews...
http://www.bloomberg.com/avp/avp.asxx?clip=mms://media2.bloomberg.com/cache/vR9.TseVnOxo.asf&vCat=/av&RND=639485018&A=
P. S: The new drama series Lie to Me, featuring British character actor Tim Roth as Dr. Cal Lightman, a "deception expert" who can tell if someone is lying just from the way they blink or shuffle their feet, is based on the true-life experiences of psychologist Dr. Paul Ekman of Berkeley, California,.
Live Well and Spend Less, If You Can...
I noticed a few articles released recently seems to be related to the same underlying issue --- how the consumer would change their behaviour during a recession. Although consumers might cut back some of their consumptions related to those luxury items they've got used to during good times, they might also turn their eyes onto other items that they may not notice before and it certainly create a huge opportunities for some providers in the market.
"...According to HTA data, as investors scour other markets for green shoots of economic recovery, garden centres and nurseries have registered healthy growth throughout the downturn, with total sales across the sector up 8 per cent in the year to April. Vegetable seed sales at Homebase are up 85 per cent and have more than doubled year-on-year at B&Q. Greenhouse sales at B&Q are also up 157 per cent on a like-for-like basis. In a YouGov survey in May, 38 per cent of those who grew their own vegetables said they did so because they could no longer afford organic food..."
"Britain’s biggest ever football crowds were in the dreary days after World War II when both goods and jobs were scarce. How come so many hard up people were spending to go through the turnstiles? One view is that recession-racked people turn away from what’s no longer comfortable and yet are desperate for entertainment..."
"...As Japanese tighten their belts in this tough economic winter, saving a few yen on a fizzy drink can be a windfall — even if it's been sitting on the shelf for two years. The Japanese have long been known for paying top prices for fine food but a growing number are becoming less fastidious about taste and quality as they get thrifty in the recession..."
Friday, 29 May 2009

Thursday, 28 May 2009
Pyramid, egg, diamond, or onion?
According to a report by the Trades Union Congres, Britain is now an onion-shaped society – with a few at the top, a bulge of people below the middle and fewer at the bottom.
Bascially, during the last 40 years, two trends are identified: the rise of a small group of super-rich and a greater concentration of the population in the bottom half of the income distribution range.
Specifically, the income distribution has become increasingly positively skewed, as the mean net household income in 2007 stood at £463 a week, 23 per cent higher than the median (£377 a week).
It has long been argued that the globalization has promoted the the shift to outsourcing. The low cost of offshore workers have enticed corporations to buy goods and services from foreign countries. The laid off manufacturing sector workers are forced into the service sector where wages and benefits are low, but turnover is high . This has contributed to the deterioration of the middle class which is a major factor in the increasing economic inequality in the western countries. Families that were once part of the middle class are forced into lower positions by massive layoffs and outsourcing to another country. This also means that people in the lower class have a much harder time climbing out of poverty because of the absence of the middle class as a stepping stone.
The primary beneficiary of globalization was the developed countries Consumer with lower prices. It is now apparent that the lower prices came at the cost of a deteriorating standard of living and middle class. The rotation of jobs into “new and better jobs” has not materialized and is not apparent.
This will certainly have important implications for the evolution of the international trade policy in western countries, especially during the downturn of global economy. The historically strong development pace of globalization in the past 60 years might moderate or even decelerate in the near future as a result of the deteriorating economy conditions in the western countries and the driving forces of the uncomfortable middle class, who might now stand up to claim back their lost benefits...
Wednesday, 27 May 2009
The Non-Sense of Non-Sense?
"According to an overwhelming majority of economists surveyed by the National Association for Business Economics, The recession in the U.S. will end this year, and joblessness will average 9.1%, More than 90% of the respondents expect the recession to end sometime this year, while 74% expect it to end in the third quarter."
Of course, these are the same folks who said there would not be a recession two years ago. Given their "excellent" track record and "wonderful" informed opinions, we can safely ignore this noise?
Of course, these are the same folks who said there would not be a recession two years ago. Given their "excellent" track record and "wonderful" informed opinions, we can safely ignore this noise?
A Dynamic Commodity Long/Short Strategy
I have recently developed a dynamic commodity long/short strategy, which is built upon a number of factors related to fundamentals, technicals, and market sentiments. Historical back-testing is very promising. Given the current volatilie market condition, this should be appealing for investors who are seeking enhanced performance but with conservative risk appetite...


Debt Debt Debt!!!
I saw this article on FT this morning,
"The federal debt was equivalent to 41 per cent of GDP at the end of 2008; the Congressional Budget Office projects it will increase to 82 per cent of GDP in 10 years. With no change in policy, it could hit 100 per cent of GDP in just another five years."
"The deficit in 2019 is expected by the CBO to be $1,200bn (€859bn, £754bn). Income tax revenues are expected to be about $2,000bn that year, so a permanent 60 per cent across-the-board tax increase would be required to balance the budget. Clearly this will not and should not happen. So how else can debt service payments be brought down as a share of GDP?"
Inflation will do it. But how much? To bring the debt-to-GDP ratio down to the same level as at the end of 2008 would take a doubling of prices. That 100 per cent increase would make nominal GDP twice as high and thus cut the debt-to-GDP ratio in half, back to 41 from 82 per cent. A 100 per cent increase in the price level means about 10 per cent inflation for 10 years. But it would not be that smooth – probably more like the great inflation of the late 1960s and 1970s with boom followed by bust and recession every three or four years, and a successively higher inflation rate after each recession.
The fact that the Federal Reserve is now buying longer-term Treasuries in an effort to keep Treasury yields low adds credibility to this scary story, because it suggests that the debt will be monetised. That the Fed may have a difficult task reducing its own ballooning balance sheet to prevent inflation increases the risks considerably. And 100 per cent inflation would, of course, mean a 100 per cent depreciation of the dollar. Americans would have to pay $2.80 for a euro; the Japanese could buy a dollar for Y50; and gold would be $2,000 per ounce. This is not a forecast, because policy can change; rather it is an indication of how much systemic risk the government is now creating.
Monday, 18 May 2009
Beer Beats Wine in Recession
A Chart compares beer and domestic wine prices from January 2008 to March 2009.
"While alcohol beverages are sometimes thought to be recession-proof, we're seeing significant evidence of changes in consumers' dinning and buying habits. People are buying larger package sizes, more domestic beverages and taking less of an experimental approach..."

"While alcohol beverages are sometimes thought to be recession-proof, we're seeing significant evidence of changes in consumers' dinning and buying habits. People are buying larger package sizes, more domestic beverages and taking less of an experimental approach..."

Friday, 15 May 2009

Thursday, 14 May 2009

Monday, 11 May 2009
China Consumer Spending vs. Savings
If you want to know whether the China story is sustainable, consider this chart — then imagine what the US version of this looks like:
>

Chart Source: Merrill Lynch, “U.S. Economics, January 2009”
Wednesday, 4 March 2009
Pink dolphin appears in US lake!
Although this is nothing to do with finance or investments, but it still catched my eyes as dolphins are always my favourate.


Charter boat captain Erik Rue, 42, photographed the animal, which is actually an albino, when he began studying it after the mammal first surfaced in Lake Calcasieu, an inland saltwater estuary, north of the Gulf of Mexico in southwestern USA.
Capt Rue originally saw the dolphin, which also has reddish eyes, swimming with a pod of four other dolphins, with one appearing to be its mother which never left its side.
He said: "I just happened to see a little pod of dolphins, and I noticed one that was a little lighter.
"It was absolutely stunningly pink.
"I had never seen anything like it. It's the same color throughout the whole body and it looks like it just came out of a paint booth.
"The dolphin appears to be healthy and normal other than its coloration, which is quite beautiful and stunningly pink.
"The mammal is entirely pink from tip to tail and has reddish eyes indicating it's albinism. The skin appears smooth, glossy pink and without flaws.
"I have personally spotted the pink dolphin 40 to 50 times in the time since the original sighting as it has apparently taken up residence with its family in the Calcasieu ship channel.
"As time has passed the young mammal has grown and sometimes ventures away from its mother to feed and play but always remains in the vicinity of the pod.
"Surprisingly, it does not appear to be drastically affected by the environment or sunlight as might be expected considering its condition, although it tends to remain below the surface a little more than the others in the pod."
Regina Asmutis-Silvia, senior biologist with the Whale and Dolphin Conservation Society, said: "I have never seen a dolphin coloured in this way in all my career.
"It is a truly beautiful dolphin but people should be careful, as with any dolphins, to respect it - observe from a distance, limit their time watching, don't chase or harass it
"While this animal looks pink, it is an albino which you can notice in the pink eyes.
"Albinism is a genetic trait and it unclear as to the type of albinism this animal inherited."
A close relation of dolphins, the Amazon River Botos, called pink dolphins, live in South America in the Amazon.
Monday, 2 March 2009
To Be Greedy When Others Fear
An article published by Citi today suggested that equity market seeks a bottom.
Basically, the arguments are:
1. The S&P 500’s year-over-year total return relative to the 10-year Treasuries has been horrendous and looks as bad as the 1932 experience. Hence, if one does want to assume that the economy is headed for the Great Depression Round Two, much of the equity market pain seems to be in place already.


2. Corporate cash levels argue for equities, but fear overwhelms everything. The 9% corporate cash to market cap level to be very important for markets in the past 25 years. Thus, even though we have moved above the 9% point, there is reason to believe that things are overdone and some support can form.

3. The worst trailing earnings developments are also supportive of equity market gains in subsequent years.

4. Poor past 10-year equity market returns provide attractive entry points for investors looking at future performance

Basically, the arguments are:
1. The S&P 500’s year-over-year total return relative to the 10-year Treasuries has been horrendous and looks as bad as the 1932 experience. Hence, if one does want to assume that the economy is headed for the Great Depression Round Two, much of the equity market pain seems to be in place already.

2. Corporate cash levels argue for equities, but fear overwhelms everything. The 9% corporate cash to market cap level to be very important for markets in the past 25 years. Thus, even though we have moved above the 9% point, there is reason to believe that things are overdone and some support can form.

3. The worst trailing earnings developments are also supportive of equity market gains in subsequent years.

4. Poor past 10-year equity market returns provide attractive entry points for investors looking at future performance

Wednesday, 18 February 2009
Junk Food, But Not Junk Stocks
A report from FT talks about the fact that Britons are filling up on buckets of fried chicken and takeaway pizza as the recession deepens, turning their backs on the fashionable restaurants and gourmet food that boomed as incomes peaked.

The growing popularity of fast food has been driven by economics, as people trim their budgets and stay at home more in the face of rising unemployment in the UK.

The growing popularity of fast food has been driven by economics, as people trim their budgets and stay at home more in the face of rising unemployment in the UK.
On the other hand, while supermarkets say people are also cooking more from scratch, there is some indication that fresher food is falling out of favour. Sales of fresh fruit and vegetables rose by 3 per cent last year, according to data provider Nielsen, less than the growth of the food market as a whole. Organic food sales have declined.
Sales of tinned goods, meanwhile, rose 8.2 per cent and frozen food sales rose 5.6 per cent after several years of stagnation.
Meanwhile, fast food chains dominate the £12.4bn franchising industry in the UK. More people have become interested in running franchises since the economy turned sour, in part because they are considered a safer form of start-up, says the British Franchising Association.
The change of living habbits will probably have some significant positive effects on those industries that are ready and are able to capitalize on these trends, such as:
1. fast food business, as people will prefer to eat at home with take-aways rather than eat out expensively in a restaurant;
2. convinient food producers, as people will prefer to those cheaper can-tin long-life products compared to other more expensive fresh food products;
3. businesses provide renting services on major home appliances, such as big screen TV, on demand movie/sports viewing compared to traditional contractual viewing;
4. alcohol retailing as people would prefer to drink at home rather thank drink more expensively in a pub;
5. home entertainments business to exploit the trend of staying at home cheaply but still having funs;
Tuesday, 17 February 2009
Shippng Index Bounce Back
An interesting chart today depicts the strong relationship between the Baltic Dry Index (a global gauge of raw-material shipping costs) and the value of those three resource-rich countries' currencies, including Norway's kroner, Australian dollar, and Canadian dollar.
The commodities prices are very depressed currently as the ecnomic crisis deepened and the gloomy outlook for the global growth. However, the underlying fundamentals related to the supply and demand side of commodities have not changed much, which should provide a long-term support for commodities. Since the beginning of the year, the Baltic Dry Index have jumped by more than 100 percent. if the trend is sustainable and resilient in the next three months, then we should expect the bounce back of the commodities prices from their current extremely low levels compared to historical standard and benefits the currencies linked to them.

The commodities prices are very depressed currently as the ecnomic crisis deepened and the gloomy outlook for the global growth. However, the underlying fundamentals related to the supply and demand side of commodities have not changed much, which should provide a long-term support for commodities. Since the beginning of the year, the Baltic Dry Index have jumped by more than 100 percent. if the trend is sustainable and resilient in the next three months, then we should expect the bounce back of the commodities prices from their current extremely low levels compared to historical standard and benefits the currencies linked to them.

Friday, 6 February 2009
Where have all the corn gone?
Credit Suisse Says Cheap Crops Won’t Last
Corn, soybean and wheat prices are trading at discounts to their inflation-adjusted averages, and all three are likely to rally because output won’t keep pace with demand for crops to make food, animal feed and alternative fuels, said Eliane Tanner at Credit Suisse Group.

Corn, soybean and wheat prices are trading at discounts to their inflation-adjusted averages, and all three are likely to rally because output won’t keep pace with demand for crops to make food, animal feed and alternative fuels, said Eliane Tanner at Credit Suisse Group.

The CHART OF THE DAY shows corn futures on the Chicago Board of Trade, adjusted for inflation, are 32 percent below their monthly average price since 1972. Corn fell to an 18-month low on the CBOT in December. Soybeans futures are 27 percent cheaper than their monthly inflation-adjusted average, and wheat is at a 25 percent discount.
“Prices have fallen too low,” Tanner, a commodity analyst in Zurich, said in a Feb. 2 note to clients. She didn’t provide price forecasts when contacted by e-mail on Feb. 3. Prices “are significantly below historical average in real terms,” Tanner said in the report.
Rising global population growth, particularly in the emerging markets, has increased demand for food and animal feed. Food supply will have to grow by 50 percent by 2030 to meet the projected demand, as climate change, water scarcity and competition for land limit the growth of crop production, according to World Bank forecasts.
World grain and oilseed production this year will fall below record harvests in 2008, Tanner said. The weather won’t be as favorable as a year ago, and farmers are planting fewer acres and using less high-cost fertilizer after crop prices dropped by more than 40 percent from last year’s records, she said.
“The weak supply-side outlook is likely to keep inventories tight and thus we expect grain prices to be vulnerable to weather-related supply shortages,” Tanner said. “Demand for agricultural commodities is relatively immune to developments in the business cycles compared to that of energy or base metals.”
Tuesday, 3 February 2009
What's the wind behind this sail?
I have recently produced a research paper on fund selection factors. While published literature has largely concentrated on the performance persistence phenomenon, research is sparse in regards to the determinants of investment performance.
In this paper, I makes a strong effort to establish robust results by comparing the performance of different fund portfolios formed based upon qualitative and quantitative fund factors, and providing an economically meaningful measure of the magnitude of the relation between performance and attributes.
On the qualitative factors side, for developed equities and bonds funds, larger funds tend to outperform smaller funds as economies of scale dominates market liquidity. Funds with lower expense ratios tend to provide better risk-adjusted performance compared to their higher expense counterparts.
On the quantitative factors side, Jensen alpha and information ratio tend to do the best job in predicting future fund performance.
Superior performance is a short-lived phenomenon that is observable only when funds are selected and sampled frequently. Therefore, fund selection framework should focus more on finding an appropriate mix of factors that successfully predict fund outperformance over shorter time periods, rather than focus on finding fund managers that consistently outperform over longer time periods.
http://www2.standardandpoors.com/spf/pdf/index/Fund_Factors_2009Jan.pdf
Monday, 2 February 2009
Consolidation in oil industry likely in 2009
Oil price continued to fall on concern that further economic contraction in the U.S., the world's biggest energy consumer, may limit fuel demand. However, it might not be a good time to buy oil but it might be a good time to look into those small to mid cap oil exploration companies as their share prices have slid more than half since last summer and quite a few bargain opportunities emerge.
Major oil companies are sitting on enormous piles of cash after posting record profits in recent quarters, while crumbling stock and crude prices have made many smaller oil and gas companies potential targets. Exxon Mobil, the world’s largest publicly traded oil company, said recently that it has $37 billion in cash.
Major oil companies are sitting on enormous piles of cash after posting record profits in recent quarters, while crumbling stock and crude prices have made many smaller oil and gas companies potential targets. Exxon Mobil, the world’s largest publicly traded oil company, said recently that it has $37 billion in cash.
Exxon Mobil Corp., BP Plc. and other oil giants are having increasing trouble securing new sources of fossil fuels the old-fashioned way — exploring and drilling.
Smaller producers that lack huge capital reserves have been stung by a credit crisis that’s severely limited or even paralyzed their ability to finance new exploration and production.
Wednesday, 28 January 2009
The collapse of the Twin Towers - International Trades and Finances
The Institute for International Finance forecasts net private sector capital flows to emerging markets will be no more than $165bn (€125bn, £116bn) this year, less than half the $466bn inflow in 2008 and only one fifth of the amount sent in the peak year of 2007.
The fall in capital flows was consistent with a worldwide reduction in the leverage maintained by financial institutions and investors, and reduced appetite for the risk often associated with such investments.
What made things worse is that private capital inflows surged to all regions (Latin America, Emerging Asia, and Emerging Europe) in 2007, before contracting sharply to all regions in 2008 and, most likely, in 2009. See chart below.

(Source: The Institute for International Finance)
The shortage of capital is particularly acute for companies that soon need to refinance debt. The IIF estimates emerging market institutions will need to refinance about $20bn a month in the first half of 2009, but that the current supply of credit covers only half that.
At the same time, the global economy is going through an unprecedented, large, rapid, synchronous, collapse in global trade.
Figure 5 captures these trends. It shows the median percent deviation from the trend of monthly, seasonally adjusted, nominal exports (in U.S. dollars) for a sample of 23 large economies. Before August of last year, this series moved in a contained range, with 90% of all observations falling in the range of -6.7% to 6.6%. But since August, this series has moved well below its historical range. The figure for November (for which we have complete data) is -21%, and it is -29% for the partial December data. This suggests that the large and widespread collapse in global trade we have seen in recent months has few parallels.

(Source: Citigroup)
The collapse of the Twin Towers - International Trades and Finances, may actually reflect the fact that the growth in emerging market is contracting at a faster pace than most people assumed, and the unprecedented pace of the decline in production and finances around the world at the end of last year implies a very sharp decline in income and a deterioating trading conditions for emerging market countries.
Tuesday, 27 January 2009
The President Effect - Too Good a president To Be True for the market?
An interesting study done by Citigroup recently tried to explore the likely market effects following the new Presidential inauguration.
The theory of the stock market “election cycle” holds that stocks tend to perform better late in a presidential term than in the immediate post-election period. The presumed causal dynamic is straightforward. Going into an election, the party in power wants a strong economy; consequently both GDP and stock prices tend to be strong in the last two years of a presidential term. Conversely, it is politically safest to restrain inflation early in a presidential term; if this requires a recession that lasts a year or so, it will set the stage for a nice economic rebound in the second half of the term — just in time for the next election.


During the four years of a President’s term, the postelection year has, historically, been the worst for stocks, with a median performance of -1%.
The median performance of the DJIA in the post-election year of eight postwar first-term Presidents was -5%.
The median performance of the DJIA in the post-election year of five “high expectation” first-term Presidents was -9%.
George W. Bush is leaving office with a relatively low job approval rating of just 34%; his successor is entering office with almost three-in-four Americans (72%) holding a favorable opinion of him. As Figure 2 illustrates, this “popularity gap” of 38% (= 72% - 34%) is the widest in the postwar period. Clearly, expectations are high for President Obama. However, those expectations may prove to be a risk for investors in 2009.

The theory of the stock market “election cycle” holds that stocks tend to perform better late in a presidential term than in the immediate post-election period. The presumed causal dynamic is straightforward. Going into an election, the party in power wants a strong economy; consequently both GDP and stock prices tend to be strong in the last two years of a presidential term. Conversely, it is politically safest to restrain inflation early in a presidential term; if this requires a recession that lasts a year or so, it will set the stage for a nice economic rebound in the second half of the term — just in time for the next election.

During the four years of a President’s term, the postelection year has, historically, been the worst for stocks, with a median performance of -1%.
The median performance of the DJIA in the post-election year of eight postwar first-term Presidents was -5%.
The median performance of the DJIA in the post-election year of five “high expectation” first-term Presidents was -9%.
George W. Bush is leaving office with a relatively low job approval rating of just 34%; his successor is entering office with almost three-in-four Americans (72%) holding a favorable opinion of him. As Figure 2 illustrates, this “popularity gap” of 38% (= 72% - 34%) is the widest in the postwar period. Clearly, expectations are high for President Obama. However, those expectations may prove to be a risk for investors in 2009.

Friday, 23 January 2009
When a flow becomes a flood
A very insightful article from Economist.com, "Global economic imbalances - When a flow becomes a flood", tries to tackle the deep root of the current financial and economic crisis.
The key argument is that "the deep causes of the financial crisis lie in global imbalances—mainly, America’s huge current-account deficit and China’s huge surplus."
ASK people what caused the financial and economic crisis and most are likely to plump for some mix of greed and incompetence. Bank bosses have been castigated for fee-seeking gluttony, reckless lending and failure to heed the risks to their institutions. Regulators have been accused of sleeping on watch. Central bankers once lionised for mastering inflation and the business cycle are feted no longer.
Few among the public would be likely to pin the blame on “global imbalances”: the pattern of large, persistent current-account deficits in America and, to a lesser extent, Britain and some other rich economies, matched by surpluses in emerging markets, notably China. The damage done to the financial system by lax controls, rotten incentives and passive regulation is plain. Yet underlying the whole mess was the deeper problem of imbalances. A growing number of policymakers and academics believe that these lay at the root of the financial crisis.
Economists had long feared that America would ruin itself on foreign borrowing. The current account, which measures the balance of investment and saving, has been in the red every year since 1992. Until 1997, the annual saving shortfall was modest but it grew steadily thereafter, reaching a peak of $788 billion, or 6% of GDP, in 2006. America needed to borrow from abroad or to sell assets—shares, bonds, property—to pay for the string of deficits. Deficits need not be ruinous, especially if they finance profitable investment. But economists worried that as America’s consumption boom took it deeper into hock, foreigners would become less willing to lend to it. That could lead to an abrupt halt to financing and a plunge in the dollar.
Puzzles and explanations
The deficits reflected a falling saving rate rather than a rising investment rate. To finance this, America was sucking in savings from abroad that could not be relied on for ever. The dollar started to decline gradually from 2002 but the current-account deficit only got bigger. There were other puzzles: long-term interest rates ought to have picked up to reflect the scarcity of American savings and the concern about the dollar. But even when the Federal Reserve started to raise short-term rates from the middle of 2004, long rates declined. The chairman of the Fed, Alan Greenspan, told Congress in February 2005 that this was a “conundrum”.
This spurred new thinking on global imbalances, which sought to rationalise why poor countries were so willing to send their savings to rich countries such as America and Britain. Ben Bernanke, now the Fed’s chairman, then a governor, argued in 2005 that America’s low saving was a passive response to a global “saving glut” washing onto its shores. It was not that America had lapped up foreign capital; rather capital had been thrust upon it. The money flooding in from willing foreign savers had bid up government-bond prices, lowering interest rates and lifting house prices. That encouraged Americans to run down savings and to keep spending.
As academics found fresh theories to explain the saving glut, they became less anxious about the imbalances it produced. The most developed financial markets were found in America, so it was the natural destination for foreign savers seeking safe returns. It could not run deficits for ever but the day of reckoning might be years away. Americans earned far higher returns on their investments abroad than foreigners did on their American assets. That and a weaker dollar helped to slow the increase in foreign indebtedness.
Both the old-school worrywarts and the new-school optimists got some elements of the story right and others wrong. “The dollar crisis that was predicted by the central view is the only one that hasn’t happened,” says Pierre-Olivier Gourinchas of the University of California, Berkeley. In the depths of the financial crisis in October, the dollar rallied against most currencies. America was not cut off from external funding. But equally there was a crisis—as the pessimists foresaw—and one that has undermined a pillar of the optimists’ thinking on imbalances: that America is a beacon of financial stability.

There are signs of a consensus emerging from these two schools. A growing band of economists agree that the forces behind the saving flows from emerging markets are likely to persist. The continuing thirst for dollar assets, albeit of the right sort, suggests that America remains a magnet for global capital. But the belief that its financial system can handle huge saving flows indefinitely has been punctured. Kenneth Rogoff of Harvard University, who had given warning of an eventual reckoning, believes that with $800 billion of net capital flows pouring into the United States in a year, some slippage of regulatory and lending standards was perhaps inevitable. The worry now is that if imbalances are not tackled, they may in time breed another calamity.
The size of the saving glut is staggering. In 1996, the year before the Asian financial crisis began, economies designated by the IMF as emerging, developing and newly industrialised ran a collective current-account deficit of $78 billion. Over the next decade this turned into a surplus of several hundred billion dollars (see chart 1), with China and oil exporters accounting for almost all of the increase in the past three or four years. Much of the turnaround is mirrored in a widening American deficit. (The world’s sums do not add up. Statisticians are unable to offset the recent burgeoning surpluses with deficits elsewhere: according to the IMF, in 2007 the surpluses exceeded the deficits by $265 billion.)
The glut and the gap
What persuades developing countries to export capital to the rich world that might be better used at home? Influences on saving vary from region to region. The income of oil-exporting countries, for instance, has ballooned since 2004 because of higher prices for crude. It would have been neither feasible nor wise for oil-rich nations to spend this windfall at home, so much of it was saved and sent abroad. Economists who have looked for something that unifies the saving behaviour of a disparate group of countries, from oil-exporters to metal-bashers, have converged on one important motive: the need to acquire reliable stores of value that can be sold easily when trouble strikes.
This idea has been developed in a series of papers by Ricardo Caballero of the Massachusetts Institute of Technology (MIT), Emmanuel Farhi of Harvard University and Berkeley’s Mr Gourinchas. Their thesis is that emerging countries cannot create enough trustworthy saving vehicles to keep up with the pace of economic growth, because their financial markets are immature. Householders cannot rely on a ready supply of credit—or on government safety nets—so must save hard for a rainy day. But the domestic supply of financial assets is unreliable so the thrifty plump for foreign assets instead. America is the favoured place because it has broad and liquid markets for securities.
That interpretation sits awkwardly with another: that excess saving, particularly in China, is the result of exchange-rate policy. Emerging-market central banks have bought dollars to weaken their own currencies. That encourages exports and depresses spending at home. The result is a high level of net national saving, much of which ends up in central banks’ foreign-exchange reserves. These rainy-day funds have swollen since 2004, mostly because of increased hoarding by oil-exporters and by China (see chart 2). How can this reflect private saving?

Mr Gourinchas doubts that depressing the exchange rate could sustain a high rate of saving for long. By flooding the foreign-exchange market with their own money, central banks risk driving up inflation which would erode the gain in competitiveness from a cheap currency. China has avoided that fate because it has been able to “sterilise” its currency interventions by selling bonds to banks, companies and households. That would be an expensive operation, says Mr Gourinchas, were it not for demand for savings. The reserves are collateral for the bonds held privately.
That may be too neat an explanation. In China’s tightly controlled financial system, savers have little choice. And firms, not households, account for the recent rise in net national saving. There is another puzzle: why have emerging-market currency reserves grown so large? This was largely a reaction to the painful memory of the Asian crisis: Asian countries wanted to insure themselves against another sudden flight of capital. Reserves need to be large enough to draw upon if foreign-currency financing suddenly dries up, and to ensure that trade flows smoothly. But reserve holdings in some emerging markets have gone way beyond levels suggested by prudential rules of thumb—enough to pay for three months of imports, say, or to cover short-term foreign-currency debt.
Research by Maurice Obstfeld of Berkeley, Alan Taylor of the University of California, Davis, and Jay Shambaugh of Dartmouth College views these “excess” reserves as insurance for the domestic banking system. They argue that in economies with managed exchange rates and fast-growing bank deposits, there is increased risk of a “double drain”. When crisis hits, fear of devaluation could spark a rush out of bank deposits into cash, and from cash into hard currency. Reserves are not only a prudent safeguard against a “sudden stop” in foreign finance. They are also needed as insurance against the risk of “sudden flight” by domestic savers.
The authors found that a measure of financial depth—the ratio of broad money to GDP—helped to explain the size of reserves. In a more recent study they found that countries with insufficient reserves to insure their financial systems suffered bigger currency crashes during last year’s turmoil. The currencies of countries with full war chests did not depreciate; some rose. If economies draw the lesson that their reserves were not big enough, global imbalances will be even harder to tackle.
Mr Taylor reckons the policy of accumulating reserves accounts for a significant and growing fraction of global surpluses—enough (in the early years of this decade) to finance as much as a third of America’s current-account deficit. The self-insurance against financial fragility is part of a more general bent towards precautionary saving in the developing world. If it persists, as seems likely, it will throw the problem of deficient global demand back to America.
An unsatisfying implication of the literature on the saving glut is that it paints America as a tragic victim of forces beyond its control (though some of the authors insist this is not their belief). The emerging markets’ need for insurance, in its many guises, drives them to export capital to America (and to similar places, such as Britain). America, by implication, has no choice but to make room for it.
In fact, Asian savings may have provided the rope; but America hanged itself. The macroeconomic forces that drove the capital flows were hard to reverse. But what made them so devastating was that they were met by microeconomic failures—described in the special report in this issue.
The interaction between the two was fatal. After the dotcom bust, American firms turned cautious and investment spending was weak. That ruled out a natural home for foreign capital. Faced with strong external demand for AAA-rated assets, the financial system got creative. Marginal home loans were packaged into supposedly safe securities. That supply of credit lifted house prices and spurred a boom in residential construction, which filled the gap in demand left by sluggish business investment.
As these loans turned bad and losses mounted, it became clear that banks had set aside too little capital to protect themselves against unexpected losses. That left the banks crippled and the economy on its knees. The villains in this story are the banks for making silly loans and regulators for not insisting on more precautions. But what would a well-regulated financial system have done with the money?

The bait for capital inflows is that America provides reliable and liquid assets, which cannot be found at home. Ideally its financial system might have provided an intermediary service—funnelling emerging-market savings into emerging-market projects. That would have lowered deficits in America and surpluses abroad. Only a fraction of the capital that flows into America is swallowed by the current-account deficit. Much of it finances capital outflows—the purchase of foreign assets by American residents (see chart 3).
In a world of perfect regulation, the likely outcome would be fewer new assets, such as securities backed by subprime mortgages, and higher prices (and lower returns) on the best assets. That implies long-term interest rates would have dropped even further. That might have given more life to business investment but it might also have fuelled a bigger housing boom, at least in prime real-estate.
Could macroeconomic policy have better addressed the global imbalances? One option would have been to keep an eye on the current-account balance when setting monetary and fiscal policy. Tighter policy might then have dampened consumer spending and curbed imports.
The trouble is that the much tighter policy needed to make a meaningful dent in the trade deficit would have led to recession in America and perhaps in emerging markets too. It would have been hard to justify with inflation so low (and it would also rule out low interest rates and fiscal stimulus now). Mr Caballero at MIT, for one, is sceptical: “I know from my experience in emerging markets that it is very hard to fight capital when it is flooding in. Policy mistakes may have been made at the margin but no more than that.” Yet America’s loose monetary policy after the dotcom bust does bear some blame. After all, a lot of subprime mortgages with variable interest rates were originated when the federal funds rate was very low.
Illustration by Bill Butcher
An alternative would be to try to tackle imbalances from all sides. That would require co-ordinated action by surplus and deficit countries. Such attempts failed in the past because everyone had something to gain from sticking with the status quo. China might think Americans should save more but only as long as that did not curb their spending on Chinese imports. America would ask China to revalue its currency and boost its domestic demand. But it was also keen for China to keep buying its public debt.
Policymakers blithely assumed they would avoid a dollar crisis and that America would export its way out of any trouble. And that was how things were starting to play out before a quite different crisis, in the financial system, blew up.
With luck and good judgment some of the worst excesses of the financial system will now be reined in. The danger is that by focusing on regulatory reform and less clumsy ways to deal with bank failures, policymakers fail to tackle the underlying causes of the crisis. The anxieties that prompt emerging markets to run big current-account surpluses have not been assuaged. Indeed, the crisis may have spurred some countries to seek even more self-insurance in reserves and other forms of prudential saving.
It’s good to talk
Earnest editorials often call for international talking shops to co-ordinate global demand. Alas, Sino-American exchanges on international economic affairs are often heated: when America’s treasury secretary, Hank Paulson, said recently that imbalances played a role in the run-up to the crisis, he provoked an outcry in China. Past failures of co-ordination initiatives do not offer much hope either. Yet as Raghuram Rajan of Chicago University’s Booth School of Business points out, the crisis has lasted a long time and there is no end in sight: so the situation may soon be ripe for a cooler exchange between surplus and deficit countries. The two big surplus countries in the rich world, Germany and Japan, are suffering deep recessions, which may bring them to the table. The problem of imbalances goes much wider than America and China.
One necessary task is to assure emerging-market countries that they will not be caught out if they run short of liquidity. The IMF might have to be prepared to offer funds more quickly and with fewer strings. Another option would be for emerging markets themselves to pool reserves. The politics of that would be messy at best. As Hélène Rey of London Business School points out, the devaluations within Europe’s exchange-rate mechanism in the early 1990s showed that risk-sharing is far from perfect even where countries have well-established political ties.
The IMF’s resources are puny in comparison with the amounts in the vaults of emerging-market central banks. That is why the swap lines offered by the Fed to four emerging economies in October were a welcome innovation (even if the recipients were flush with their own reserves). But countries will not be persuaded to stop accumulating reserves unless such credit lines can be relied upon in future. The Fed cannot be asked to vet potential recipients: that may be a job for the fund.
America, Britain and other deficit countries have drowned themselves in cheap credit from abroad. Because the structural forces behind the global saving glut are unlikely to abate quickly, there is a real risk that the dangerous imbalances will persist—with America’s public sector as the new consumer of last resort. It would be foolish to focus on fixing the financial industry only to find that the public finances are left in ruins.
Subscribe to:
Comments (Atom)


